How Many Americans Own Cars? 51 Car Ownership Statistics
Did you know that there are 275 million vehicles registered in the U.S?
You’re about to see a list of the latest car ownership statistics.
Read on to find new stats, facts, and trends related to:
- Car ownership statistics
- How many cars are in the US?
- Car ownership by year
- Car ownership by city
- Car ownership by state
- What percentage of Americans own a car?
- Global car ownership statistics
- A whole lot more
Let's dive in!
Key Car Ownership Statistics
- There are 275,924,442 million vehicles registered in the United States as of 2020.
- The number of registered vehicles in the US increased by 4.7% from 2015 to 2020.
- 91.5% of households had at least one vehicle available in 2020. This means only 8.5% didn't.
- Montana has the highest average registered vehicles per household in the country - 4.5.
- By the end of 2020, there were 1,019,260 electric vehicles registered in the US.
- It might surprise you that trucks, not automobiles, were the most popular type of vehicle in 2020.
- 96.2% of households in Wyoming have access to at least one vehicle, compared to only 71.0% in New York and just 64.6% in Washington, D.C.
- California, Texas, and Florida have the most vehicle registrations, largely due to their population and size.
- New York City has the lowest percentage of vehicle ownership in the U.S.
Chapter 1: How Many Cars Are In The US?
There are 275,924,442 million vehicles registered in the United States as of 2020.
More trucks are owned in the U.S. than any other vehicle type. Cars come in second place before motorcycles and buses.
In fact, the number of registered vehicles in the US increased by 4.7% from 2015 to 2020.
U.S. Private and Commercial Ownership By Vehicle Type (FHWA)
| Automobile | Buses | Trucks | Motorcycles | ALL |
|---|---|---|---|---|
| 107,180,635 | 575,193 | 156,080,086 | 8,566,564 | 272,402,478 |
There is a very noticable difference in the type of car ownership in the U.S. While there are less than 4.1 million publicly owned vehicles, there are more than 272.4 million privately owned vehicles which mean together, they comprise the more 275 million vehicles owned in the United States.
U.S. Vehicle Ownership by Type (FHWA)
| Private and commercial | Publicly owned vehicles | Total motor vehicles |
|---|---|---|
| 272,402,478 | 4,088,696 | 276,491,174 |
Chapter 2: Car Ownership By Year
The number of total registered vehicles in the US is steadily growing year-over-year. From 2014 to 2020, there has been consistent growth as there were about 260 million vehicles in 2014, but by 2020, that number had increased to more than 275 million total registered U.S. vehicles.
Car Ownership Year-over-Year, 2014-2020 (FHWA)
| Year | Total U.S. registered vehicles |
|---|---|
| 2020 | 275,924,442 |
| 2019 | 276,491,174 |
| 2018 | 273,595,656 |
| 2017 | 272,429,803 |
| 2016 | 268,799,083 |
| 2015 | 263,610,219 |
| 2014 | 260,350,938 |
Chapter 3: Car Ownership By City
Depending on where you live in the U.S., vehicle ownership varies significantly.
There are several factors that impact the number of vehicles owned in a city, including size, population, demographics, and more.
Bankrate's analysis recently found that vehicle ownership is highest outside U.S. metropolitan areas. For example, there are several areas in Texas, California, Arizona, and Colorado that have the lowest percentage of vehicles among households. Keep reading:
10 U.S. Cities with the Highest Percentage of Vehicle Ownership
| Rank | City | Percentage of households that own vehicles |
|---|---|---|
| 1 | Murietta, CA | 99.3% |
| 2 | League City, Texas | 99.0% |
| 3 | Surprise, Arizona | 98.7% |
| 4 | West Jordan, Utah | 98.7% |
| 5 | Cary, North Carolina | 98.6% |
| 6 | Pearland, Texas | 98.6% |
| 7 | Highlands Ranch, Colorado | 98.5% |
| 8 | Centennial, Colorado | 98.3% |
| 9 | Gilbert, Arizona | 98.3% |
| 10 | Elk Grove, California | 98.2% |
Some of America's largest metropolitan areas have the lowest vehicle ownership rates, which is mainly due to ready access to public transportation, as well as the high cost of parking your car in these cities.
New York City has the lowest percentage of vehicle ownership in the U.S. Followed by NYC is the nearby metropolis Newark located in New Jersey.
Washington, D.C. and Massachusetts are areas with lower vehicle ownership among U.S. households.
10 U.S. Cities with the Lowest Percentage of Vehicle Ownership
| Rank | City | Percentage of households that own vehicles |
|---|---|---|
| 1 | New York, New York | 45.6% |
| 2 | Newark, New Jersey | 59.7% |
| 3 | Washington, D.C. | 62.7% |
| 4 | Jersey City, New Jersey | 62.9% |
| 5 | Cambridge, Massachusetts | 63.2% |
| 6 | Boston, Massachusetts | 66.2% |
| 7 | Paterson, New Jersey | 67.0% |
| 8 | Hartford, Connecticut | 67.4% |
| 9 | San Francisco, California | 70.1% |
| 10 | Philadelphia, Pennsylvania | 70.5% |
The state with the most cars per household in the U.S. is California, with 9 of the top 10 U.S. cities for vehicle ownership.
10 U.S. Cities with the Most Cars Per Household
| Rank | City | Percentage of households that own vehicles |
|---|---|---|
| 1 | Murrieta, California | 2.36% |
| 2 | Jurupa Valley, California | 2.32% |
| 3 | Moreno Valley, California | 2.32% |
| 4 | West Jordan, Utah | 2.3% |
| 5 | Simi Valley, California | 2.29% |
| 6 | Corona, California | 2.29% |
| 7 | Norwalk, California | 2.27% |
| 8 | Pomona, California | 2.27% |
| 9 | Fontana, California | 2.27% |
| 10 | Santa Ana, California | 2.25% |
Chapter 4: Car Ownership By State
| State | Private and Commercial | Public | All Private and Commercial Motor Vehicles* | Total for All Private and Publicly Owned Vehicles* |
|---|---|---|---|---|
| Alabama | 2,065,223 | 43,886 | 2,109,108 | 5,288,208 |
| Alaska | 174,496 | 4,020 | 178,516 | 795,275 |
| Arizona | 2,387,462 | 18,496 | 2,405,959 | 5,982,559 |
| Arkansas | 874,634 | 12,013 | 886,647 | 2,902,111 |
| California | 14,654,371 | 240,541 | 14,894,912 | 31,247,270 |
| Colorado | 1,724,841 | 16,377 | 1,741,218 | 5,412,404 |
| Connecticut | 1,260,063 | 891 | 1,260,954 | 2,878,548 |
| Delaware | 422,002 | 1,460 | 423,462 | 1,016,927 |
| District of Columbia | 184,832 | 18,939 | 203,771 | 350,463 |
| Florida | 7,732,491 | 108,698 | 7,841,189 | 17,833,720 |
| Georgia | 3,445,471 | 54,049 | 3,499,520 | 8,594,567 |
| Hawaii | 492,034 | 6,958 | 498,992 | 1,272,361 |
| Idaho | 599,749 | 2,421 | 602,170 | 1,954,528 |
| Illinois | 4,286,622 | 36,228 | 4,322,850 | 10,691,947 |
| Indiana | 2,183,343 | 2,636 | 2,185,979 | 6,223,460 |
| Iowa | 1,210,633 | 11,210 | 1,221,843 | 3,786,328 |
| Kansas | 943,138 | 4,009 | 947,148 | 2,682,337 |
| Kentucky | 1,638,625 | 30,542 | 1,669,167 | 4,383,223 |
| Louisiana | 1,321,964 | 27,756 | 1,349,720 | 3,802,746 |
| Maine | 370,051 | 3,817 | 373,868 | 1,130,056 |
| Maryland | 1,841,711 | 27,283 | 1,868,994 | 4,203,994 |
| Massachusetts | 2,085,100 | 3,574 | 2,088,674 | 5,061,260 |
| Michigan | 2,810,414 | 21,085 | 2,831,499 | 8,440,065 |
| Minnesota | 1,821,645 | 15,186 | 1,836,831 | 5,425,885 |
| Mississippi | 803,827 | 2,234 | 806,061 | 2,066,681 |
| Missouri | 2,035,762 | 17,026 | 2,052,788 | 5,534,289 |
| Montana | 438,642 | 477 | 439,118 | 1,900,806 |
| Nebraska | 647,411 | 14,453 | 661,864 | 1,968,479 |
| Nevada | 1,052,571 | 7,618 | 1,060,188 | 2,546,583 |
| New Hampshire | 486,514 | 2,710 | 489,224 | 1,363,379 |
| New Jersey | 2,616,279 | 22,982 | 2,639,261 | 6,033,015 |
| New Mexico | 635,272 | 6,566 | 641,838 | 1,825,421 |
| New York | 4,425,722 | 18,669 | 4,444,391 | 11,389,158 |
| North Carolina | 3,390,087 | 44,478 | 3,434,565 | 8,527,388 |
| North Dakota | 224,952 | 3,929 | 228,881 | 903,668 |
| Ohio | 4,380,516 | 42,732 | 4,423,248 | 10,901,279 |
| Oklahoma | 1,249,360 | 5,774 | 1,255,134 | 3,706,624 |
| Oregon | 1,399,619 | 25,181 | 1,424,799 | 3,919,157 |
| Pennsylvania | 4,222,743 | 45,067 | 4,267,811 | 10,800,315 |
| Rhode Island | 389,425 | 7,083 | 396,508 | 868,942 |
| South Carolina | 1,724,396 | 76,847 | 1,801,243 | 4,516,143 |
| South Dakota | 337,367 | 5,502 | 342,868 | 1,280,969 |
| Tennessee | 2,137,154 | 48,074 | 2,185,229 | 5,817,887 |
| Texas | 8,223,542 | 90,080 | 8,313,623 | 23,007,146 |
| Utah | 910,430 | 11,216 | 921,645 | 2,430,275 |
| Vermont | 202,897 | 3,724 | 206,621 | 620,428 |
| Virginia | 3,145,500 | 41,526 | 3,187,026 | 7,647,692 |
| Washington | 2,877,533 | 66,381 | 2,943,914 | 7,377,028 |
| West Virginia | 525,159 | 11,488 | 536,646 | 1,668,113 |
| Wisconsin | 1,973,948 | 30,053 | 2,004,002 | 5,666,400 |
| Wyoming | 193,092 | 3,127 | 196,219 | 843,671 |
| TOTAL | 109,813,571 | 1,428,561 | 269,417,884 | 273,595,656 |
Chapter 5: Car Ownership Demographics
By Race
Here are up-to-date car ownership statistics by race.
If you'd like more information on statistics surrounding car ownership and race, read more at Governing.com, the University of Michigan, and UC Berkeley News.
- In 2006, researchers at UC Berkeley found black households were significantly less likely to own a car than were white households. This showed a growing gap between car ownership in white and black households that spanned various levels of income.
- 4.6 of White Americans reported living in a home without any access to a vehicle.
- 19% of African Americans reported living in a home without any vehicle access.
- 13.7% of Latino households reported not having any access to a vehicle.
- White Americans accounted for 64.7% of car buyers in 2015 in the United States.
- Hispanic people accounted for 12.2% of U.S. car buyers in 2015.
- In 2015, the purchasing power of African- and Asian-Americans put together made up less than 15% of total car buying power in the U.S.
By Age
Research published by the Federal Reserve shows the average age of a new car or truck buyer is around 53 years old.
Over the past decade, this age has increased a noticable amount, and among new vehicle buyers, the 55+ age group has a 15% increase since 2000.
| Males | Females | |
|---|---|---|
| 19 and Under | 3.94% | 3.8% |
| 20-24 | 7.89% | 7.5% |
| 25-29 | 8.98% | 8.8% |
| 30-34 | 8.85% | 8.7% |
| 35-39 | 8.65% | 8.6% |
| 40-44 | 7.96% | 7.9% |
| 45-49 | 8.49% | 8.4% |
| 50-54 | 8.59% | 8.5% |
| 55-59 | 9.01% | 9.0% |
| 60-64 | 8.29% | 8.4% |
| 65-69 | 6.90% | 7.1% |
| 70-74 | 5.30% | 5.5% |
| 75-79 | 3.45% | 3.6% |
| 80-84 | 2.06% | 2.3% |
| 85 and older | 1.64% | 1.9% |
- In 2000, the average age of new-vehicle buyers was 43 years old. Eleven years later, the average age is around 53 years old, according to J.D. Power and Associates.
- Between 2000 and 2015, the share of new vehicles purchased by those aged 16 to 34 decreased by around 6%, according to Hedges & Company.
- In approximately 15 years, the share of new vehicles purchased by people aged 35 to 49 decreased by 9%.
- Those aged 16 to 34 today are the least frequent buyers of new vehicles.
- The average age of new-vehicle buyers increased by almost 7 years between 2000 and 2015, according to Hedges & Company. The aging of the population reflected some of that increase, but also changes in buying patterns among people in various age groups.
By Income Level
There is a sharp increase in vehicle ownership once income surpasses $50,000. Low income earners find it very difficult to have their own vehicle largely due to the high running costs of owning a car.
By Gender
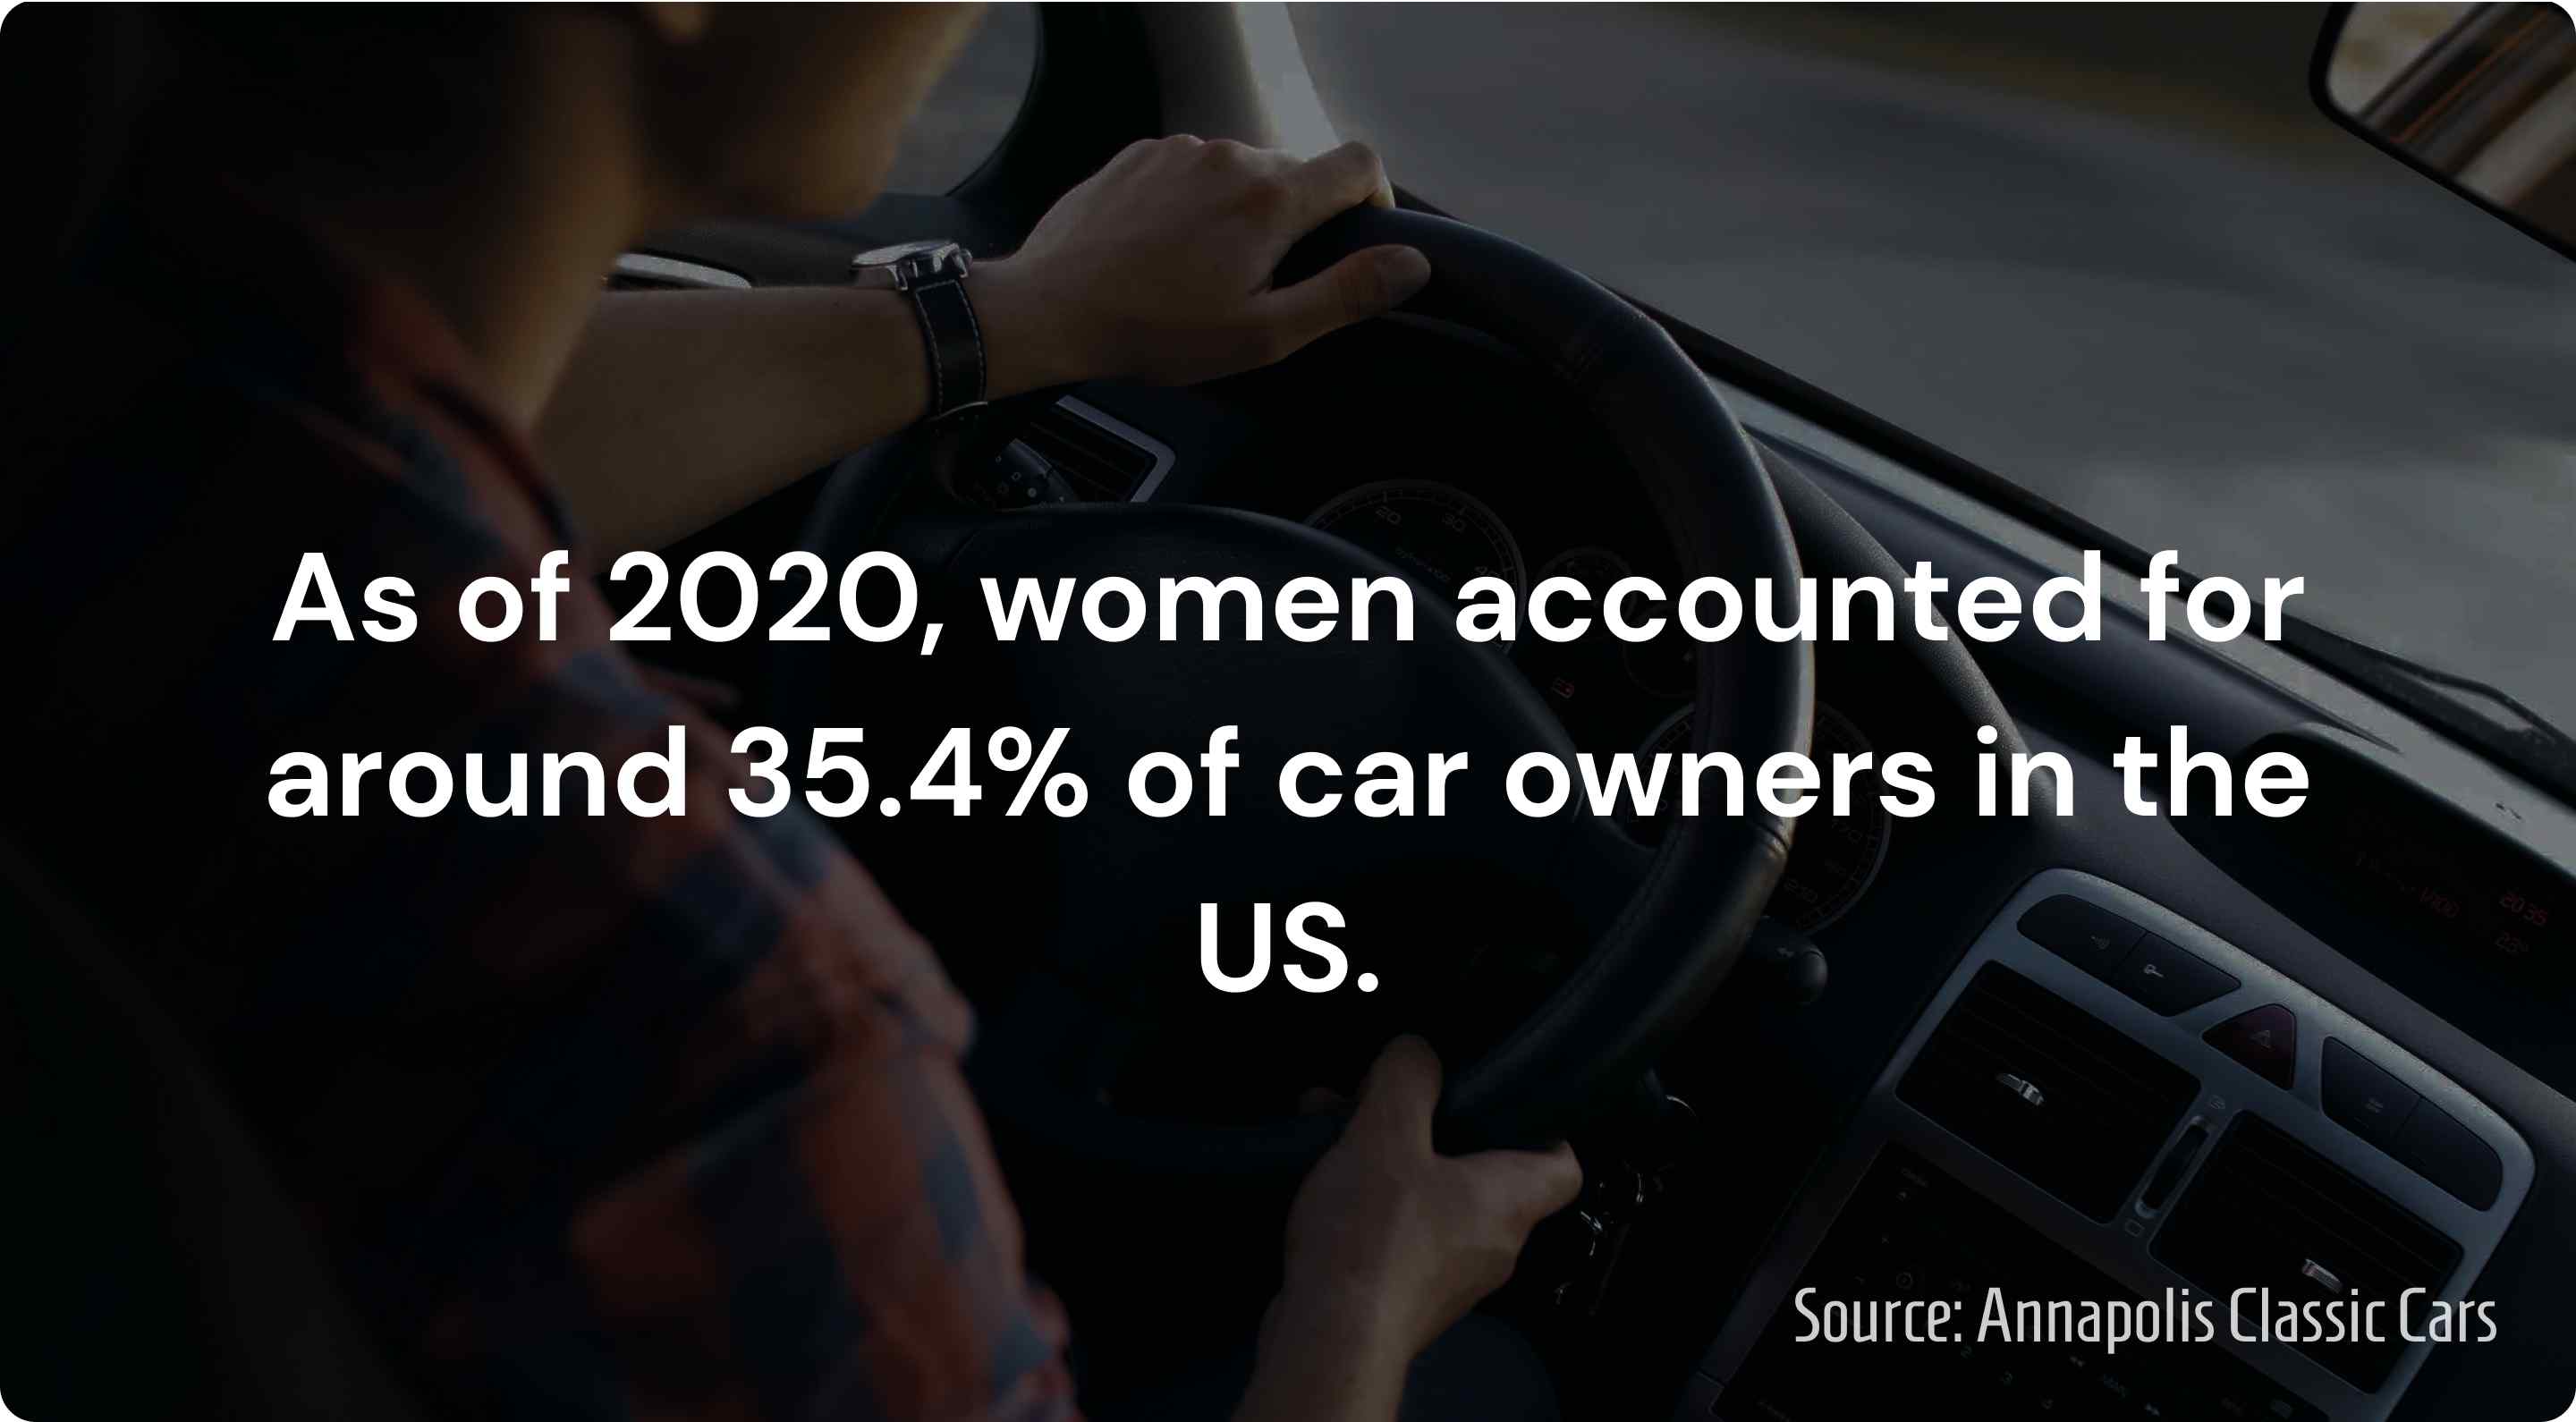
In the United States, men are much more likely to own cars than women, even though more women hold a valid driver's license as of 2019. As of 2020, women accounted for around 35.4% of car owners in the US.
Chapter 6: What Percentage Of Americans Own A Car?
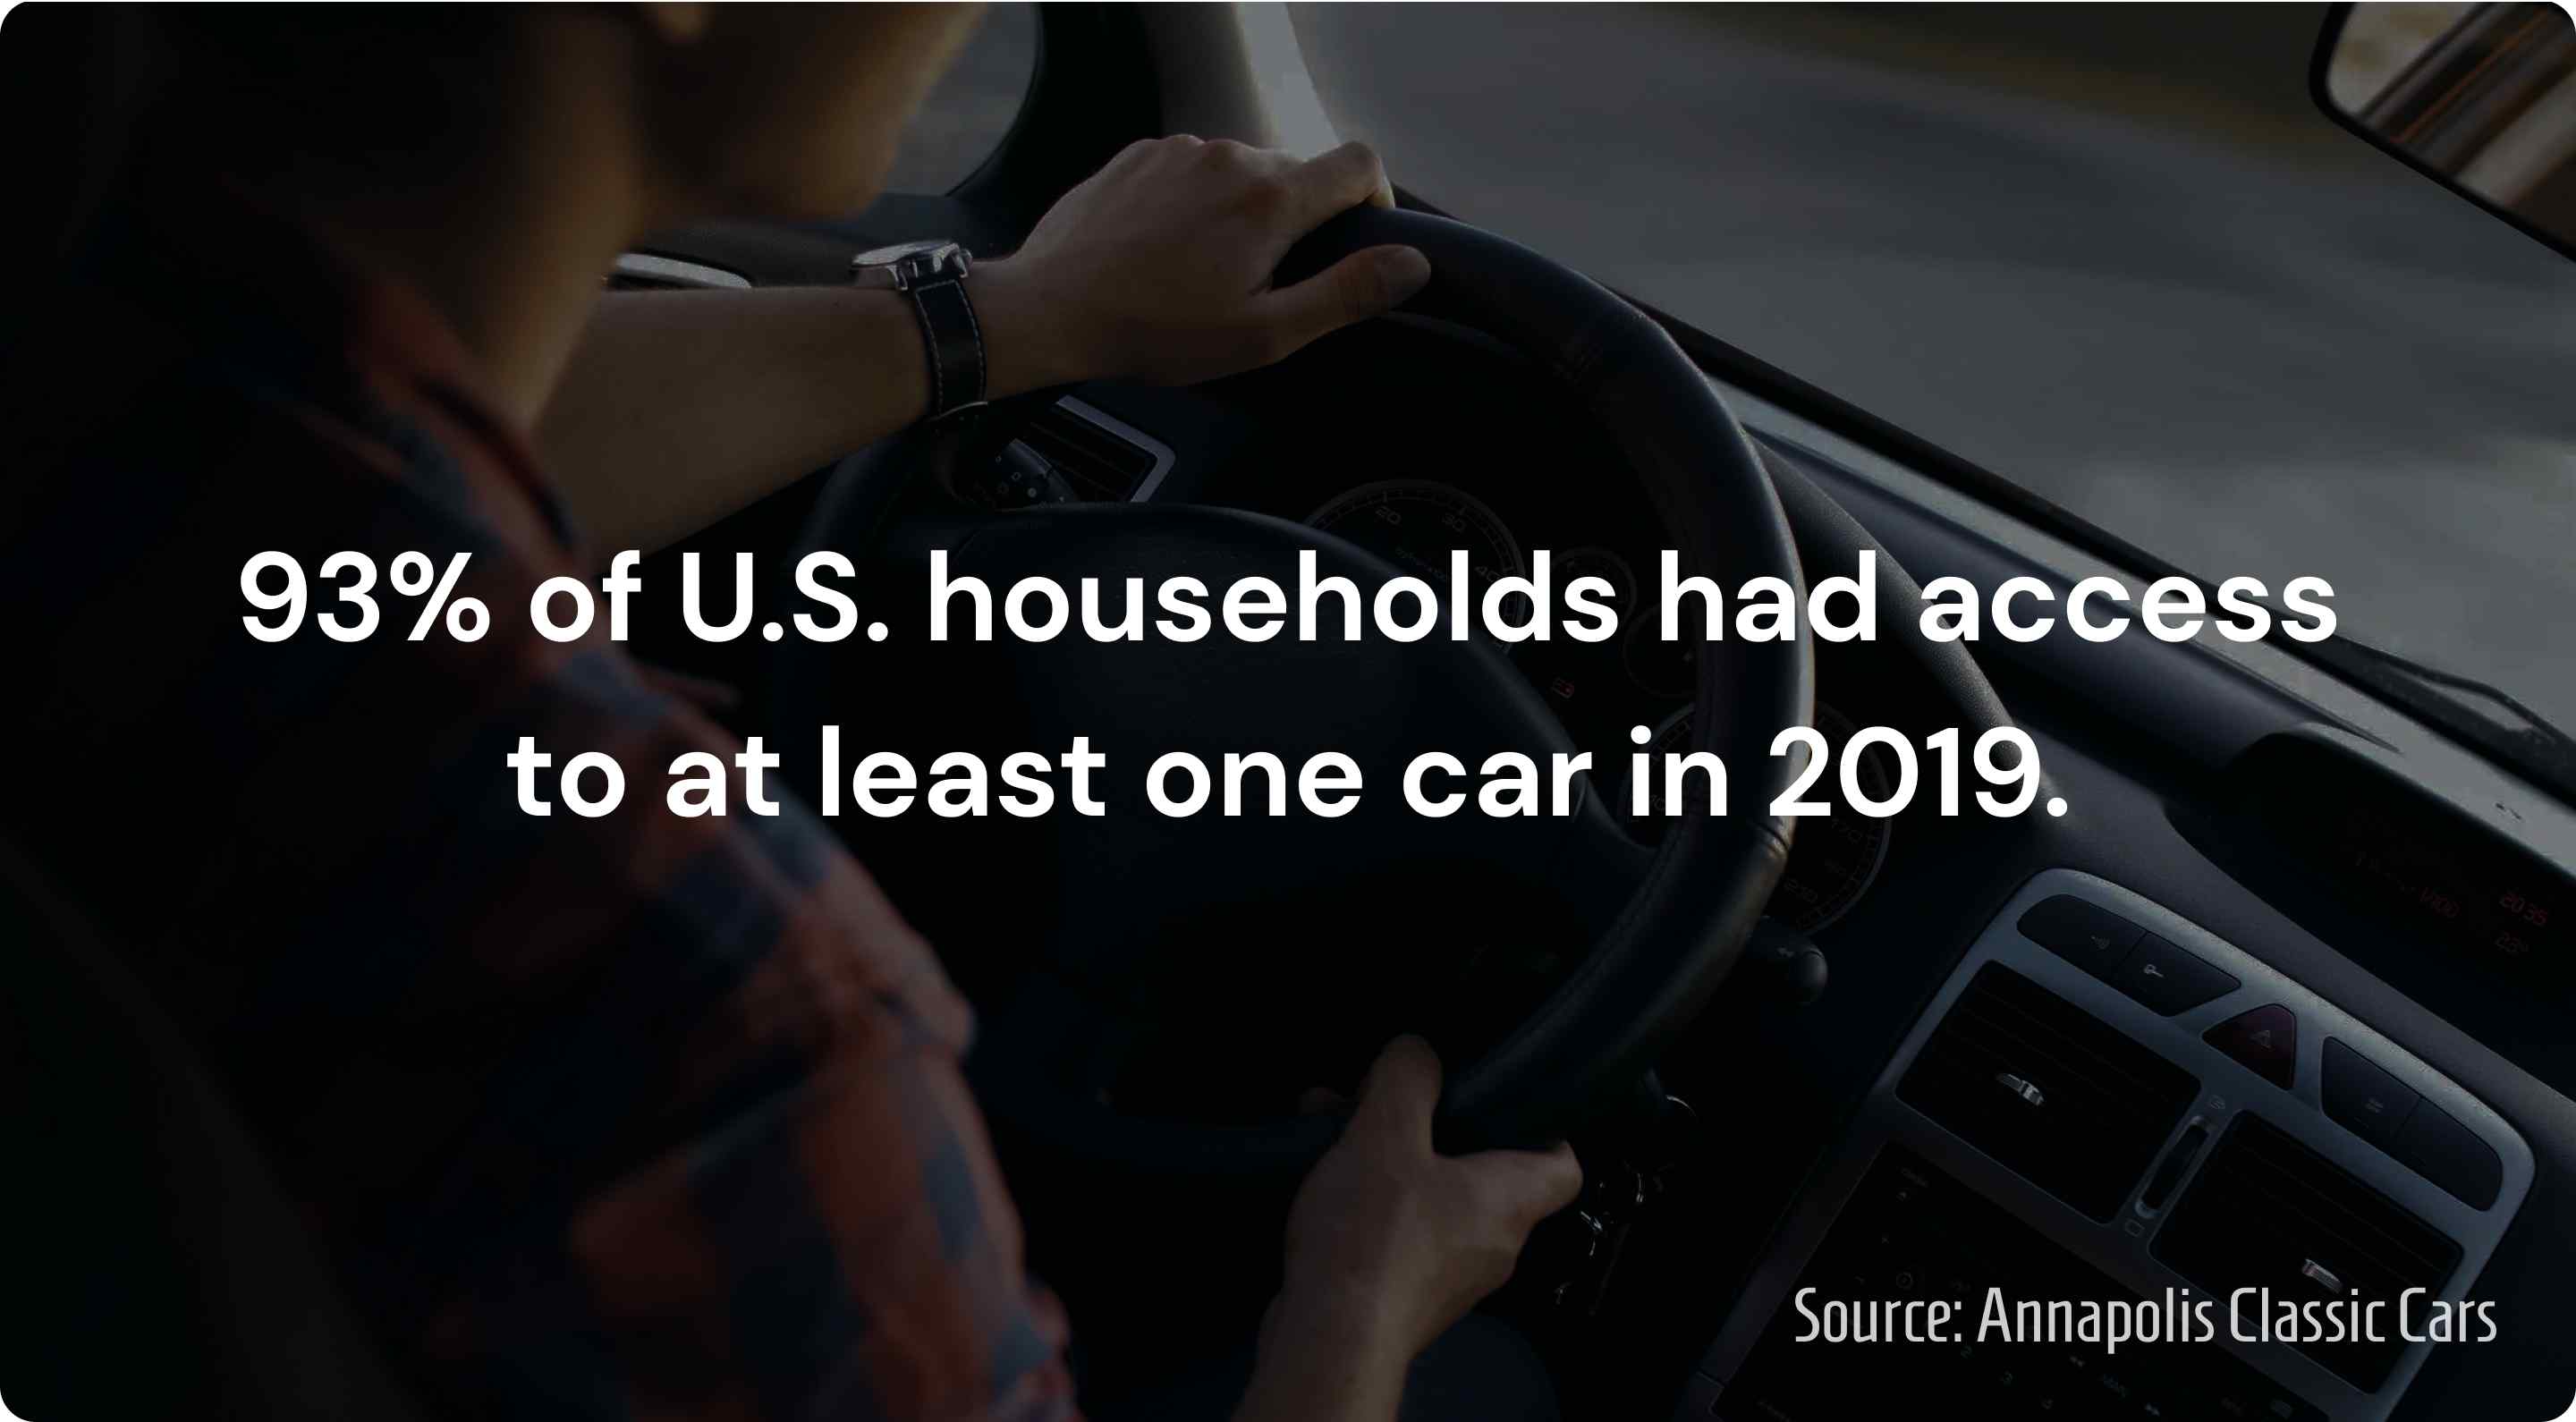
93% of U.S. households had access to at least one car in 2019, according to data from the Federal Highway Administration.
Vehicle ownership is increasing in an analysis of a 5-year period from 2015 to 2019. Interestingly, the number of households with one or two vehicles has decreased over time.
On the other hand, there has been a consistent increase in vehicles of three or more per household.
This shows a strong indication that since American households are growign in size, the number of vehicles is also increasing to accommodate more people.
Studies also show an increase in income, allowing Americans to afford the car payment in addition to costs of insurance and maintenance.
Percentage Of Americans That Own More Than One Car
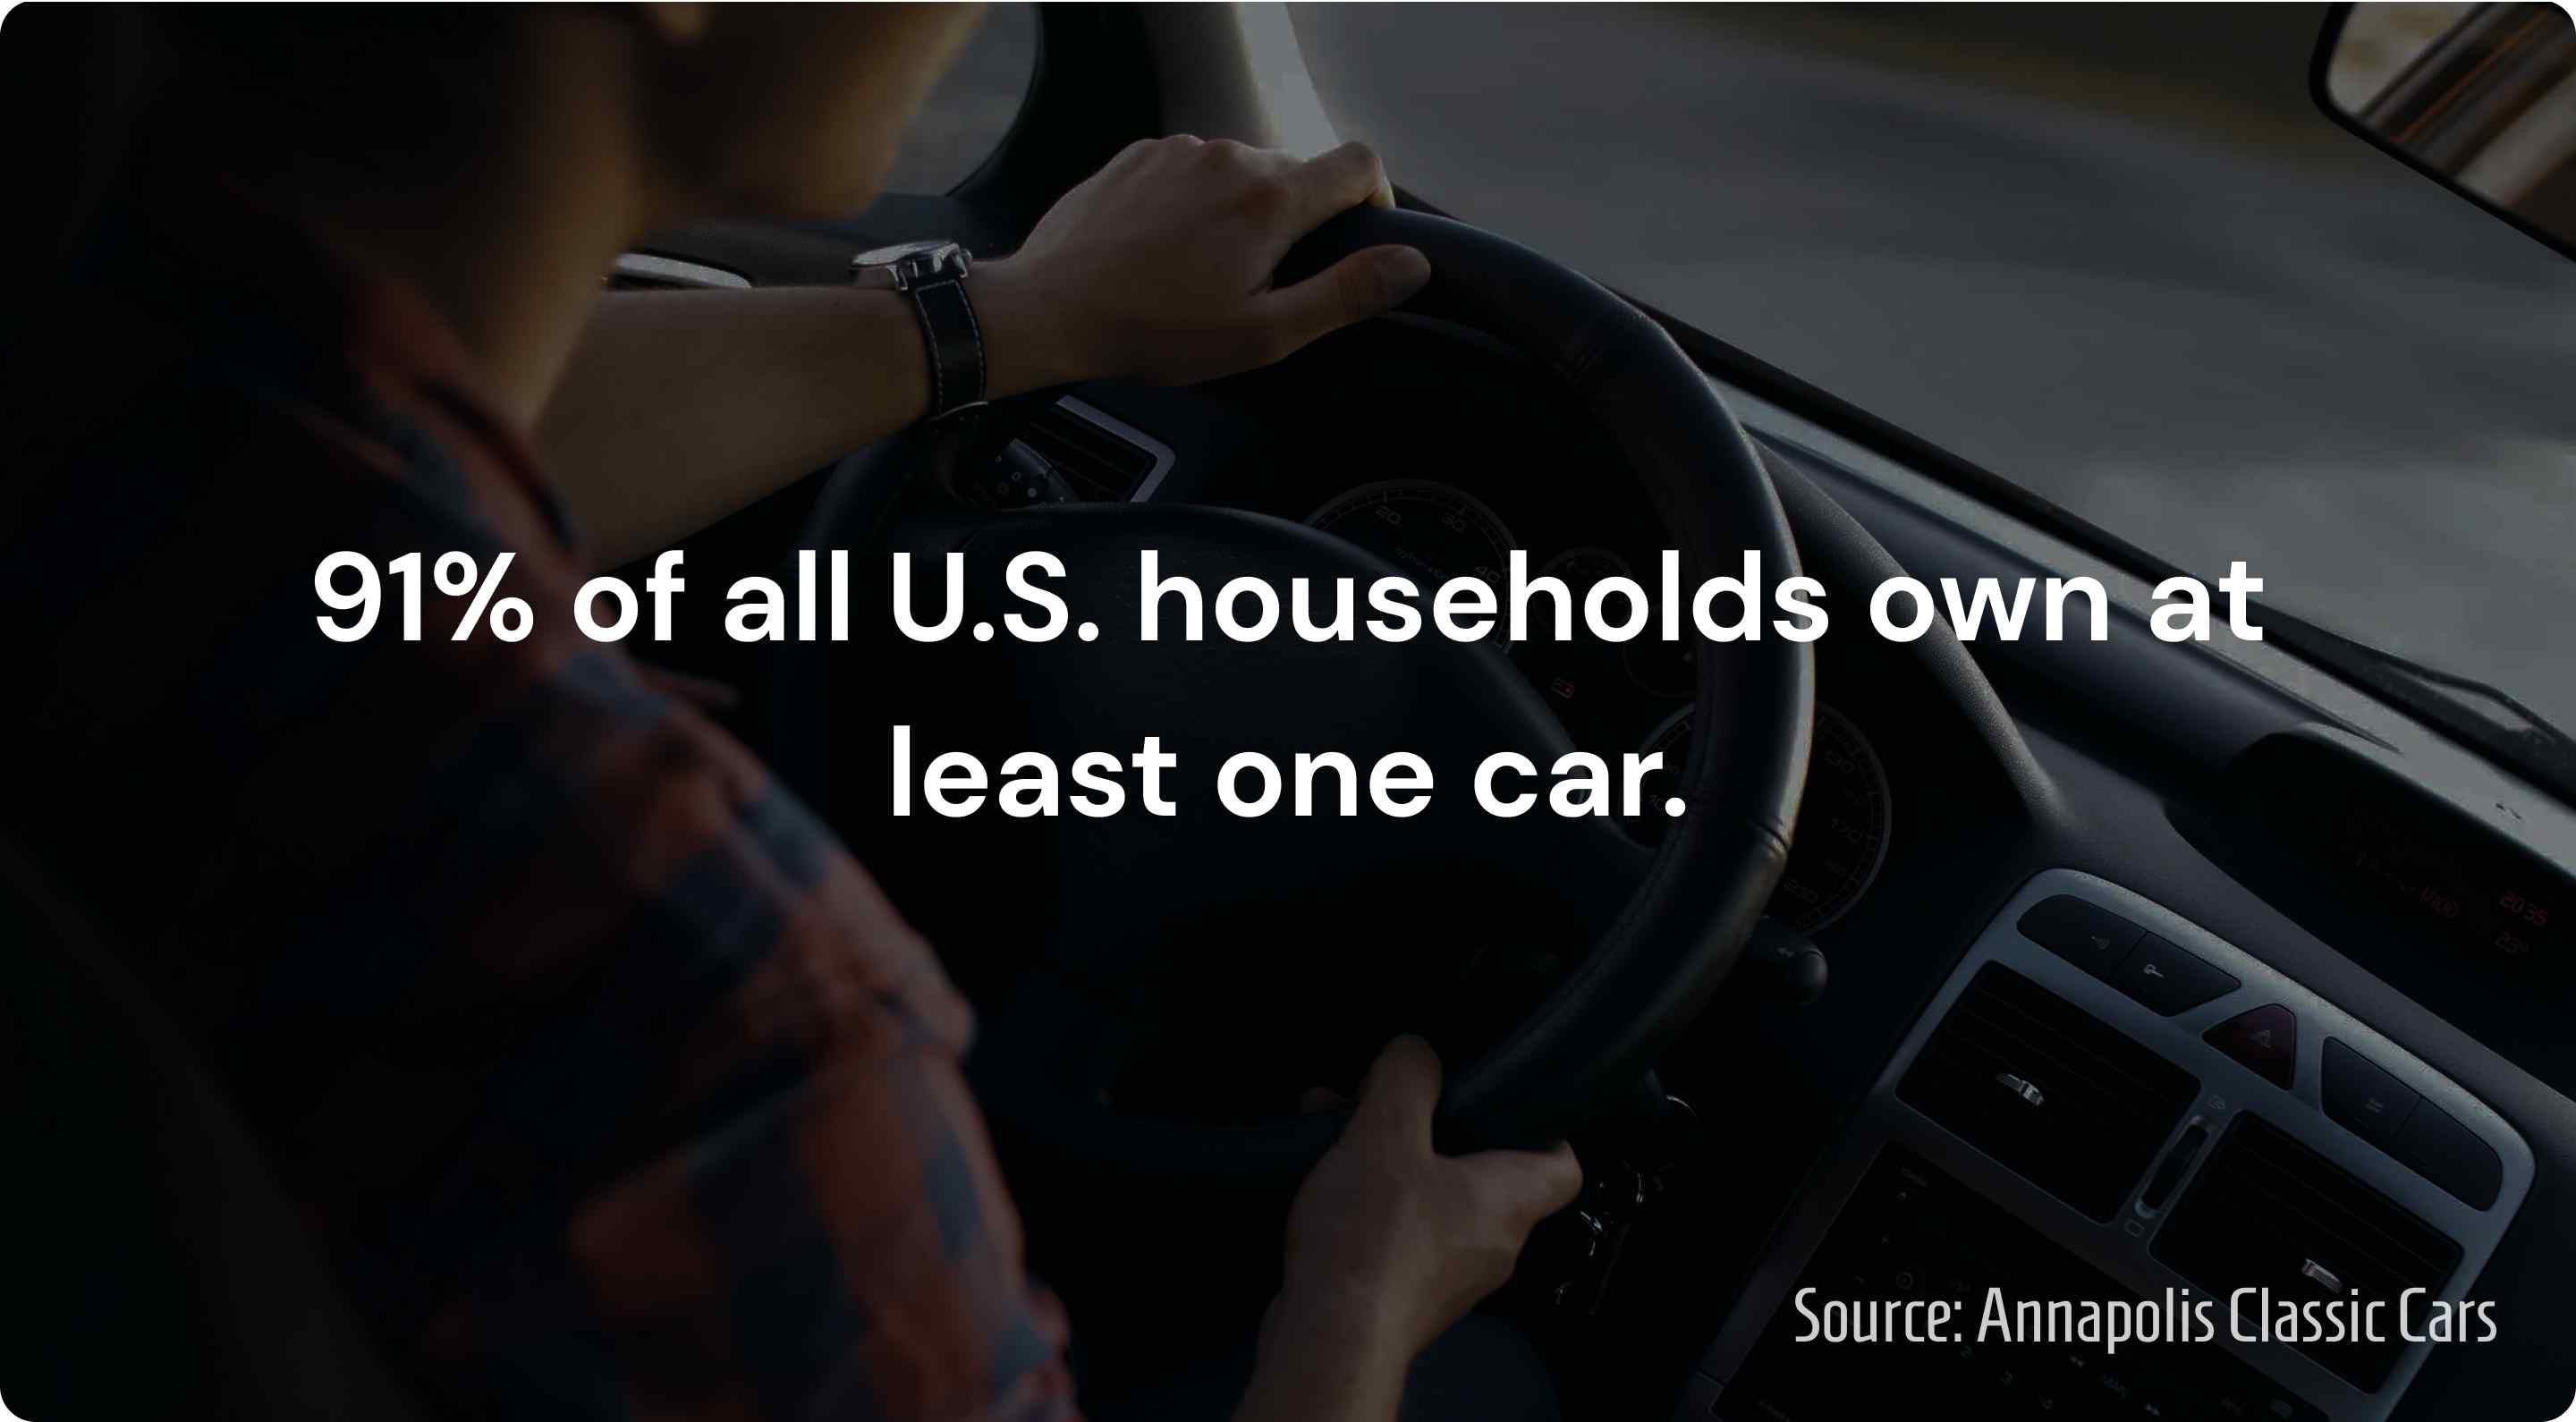
Only 9% of households in the United States don't own even a single car, which means 91% of all U.S. households own at least one car. Interestingly, 33% of households own a single car, leaving 33.1% that own two cars, 24% that own three, and 3.4% that own more than five vehicles.
U.S. Residential Vehicle Accessibility
| 2019 | 2018 | 2017 | 2016 | 2015 | |
|---|---|---|---|---|---|
| No vehicles available | 8.6% | 8.7% | 8.8% | 9.0% | 9.1% |
| 1 vehicle available | 32.7% | 33.0% | 33.2% | 33.6% | 33.7% |
| 2 vehicles available | 37.2% | 37.3% | 37.4% | 37.3% | 37.4% |
| 3+ vehicles available | 21.4% | 21.0% | 20.6% | 20.1% | 19.8% |
Chapter 7: Global Car Ownership Statistics
How much of the world’s population owns cars?
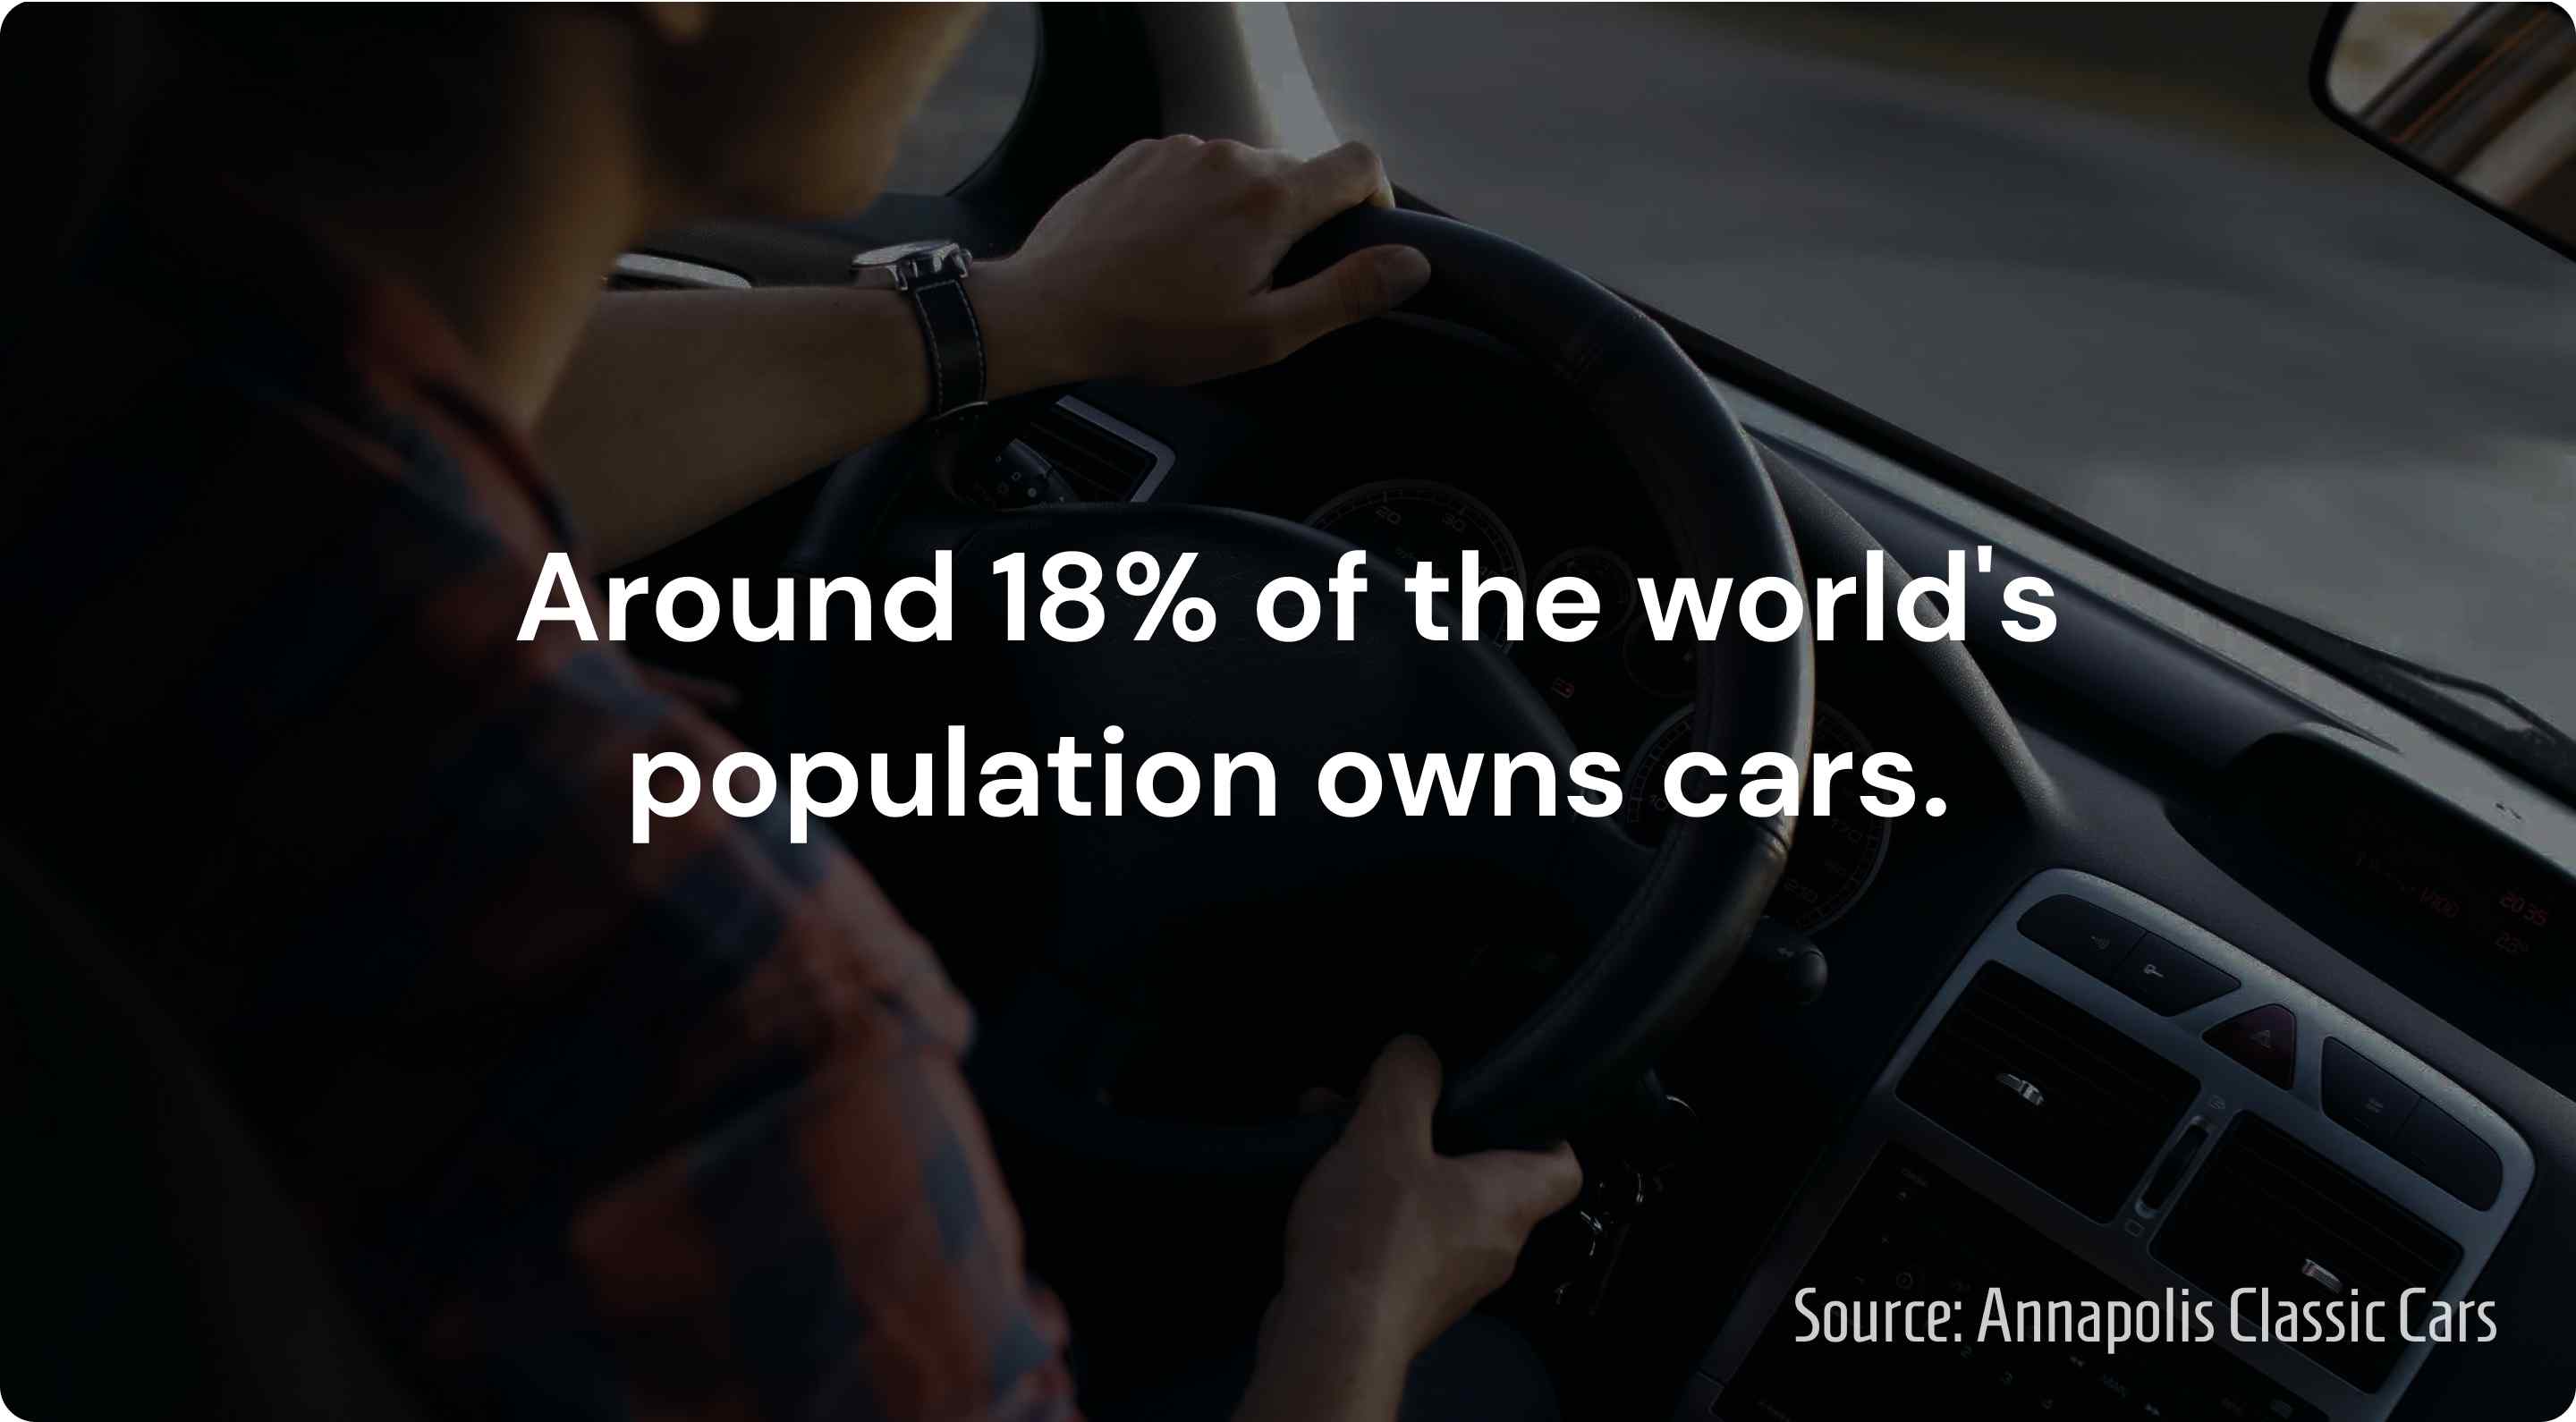
According to the most recent estimates, the world's population is 7.6 billion, and with an estimated 1.4 billion cars on the road, that means around 18% of the world's population owns cars.
Which country has the highest car ownership?
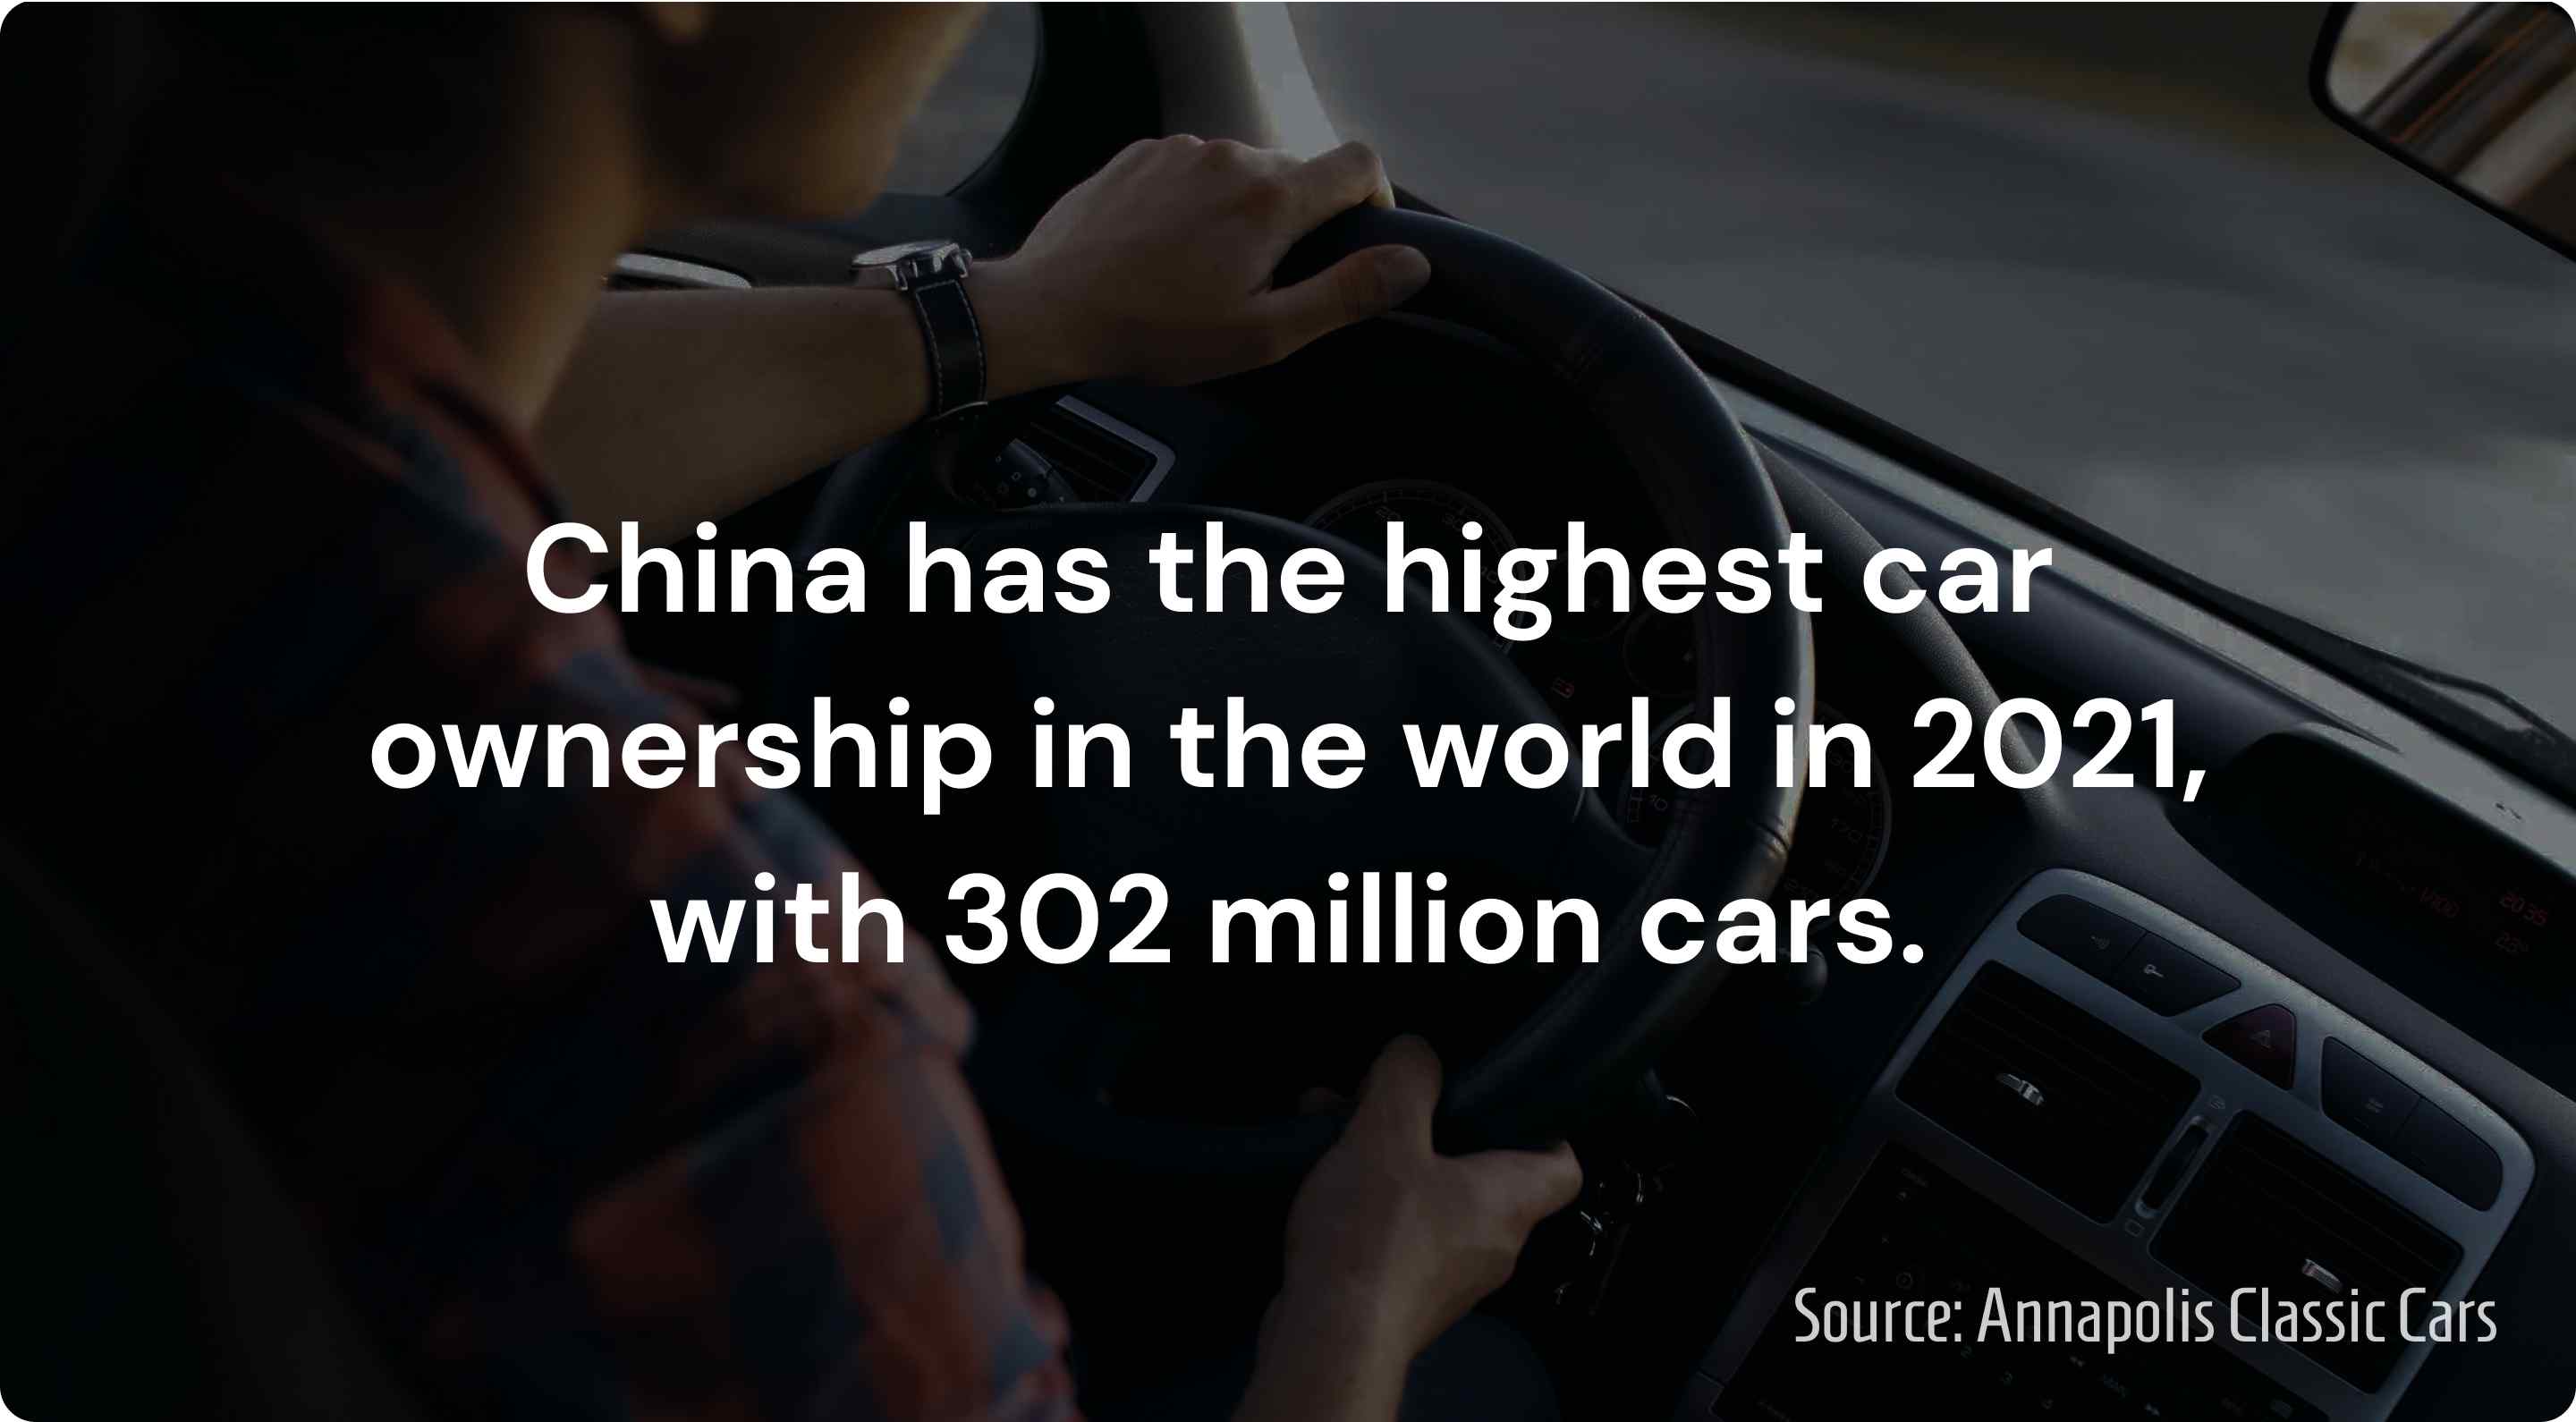
China has the highest car ownership in the world in 2021, with 302 million cars, and in 2009 the country became the world's largest new car market.
In fact, in 2011, 80 million cars and commercial vehicles were built, led by China, with 18.4 million motor vehicles manufactured that same year.
How many cars are owned globally?
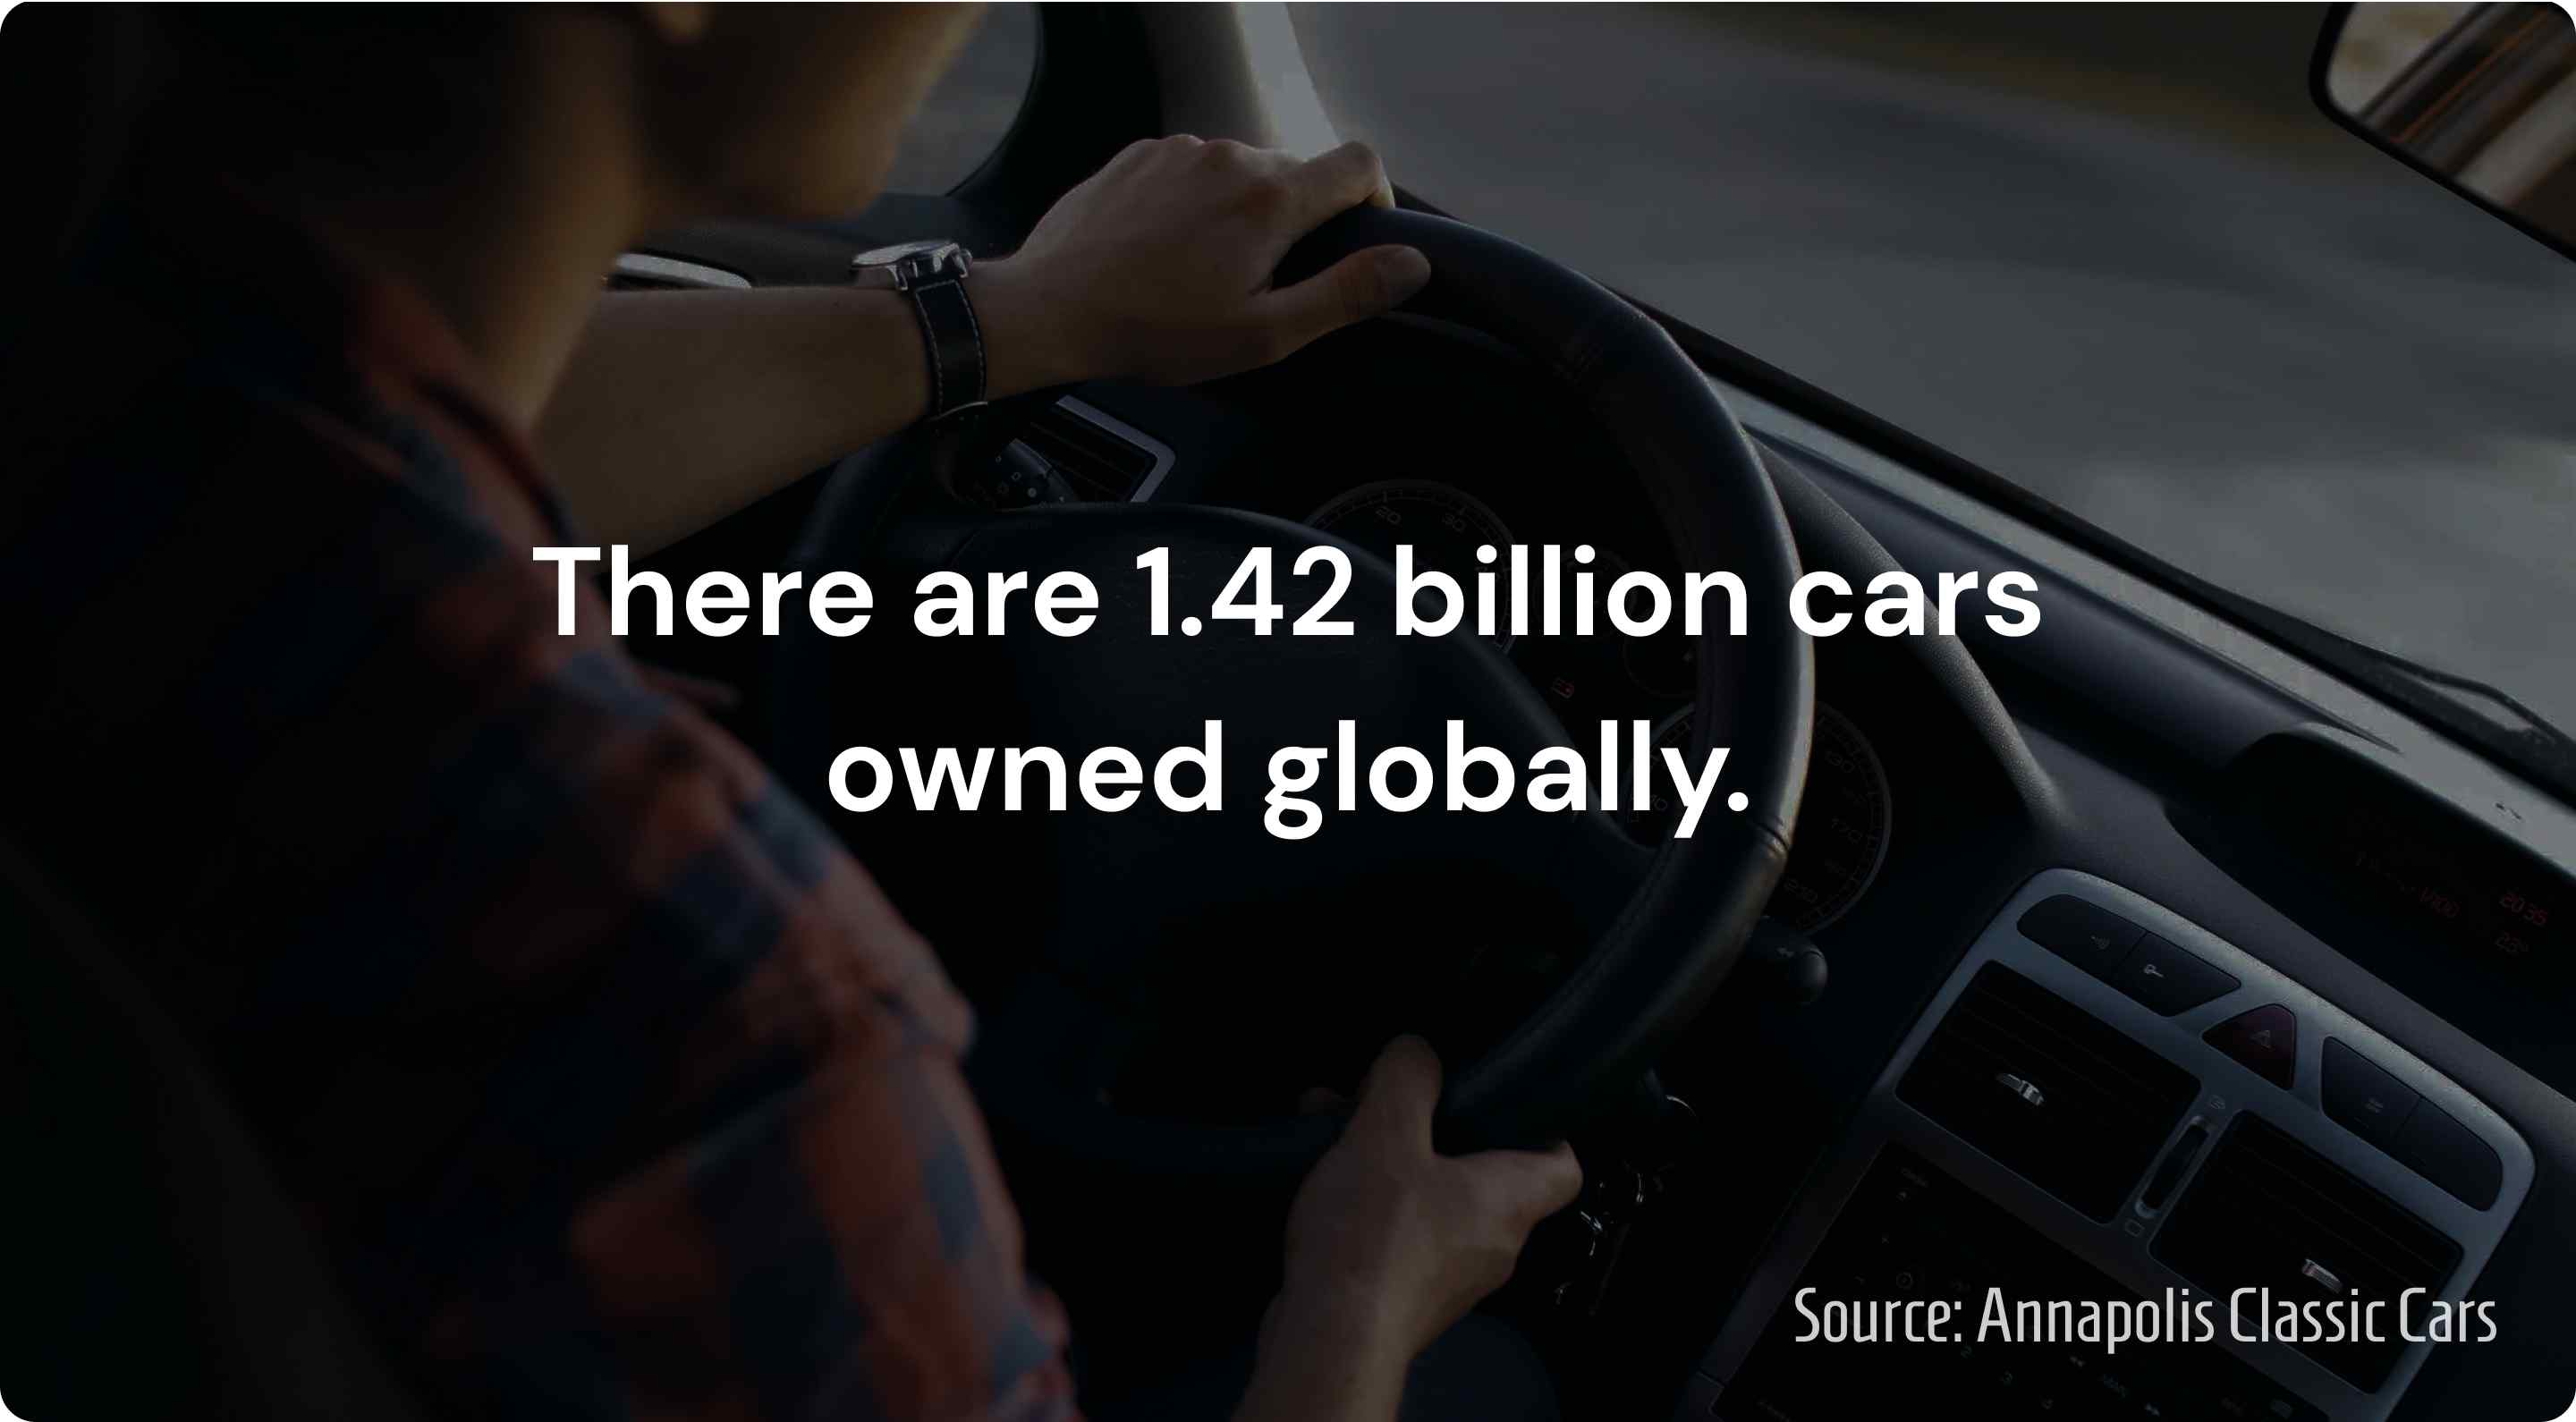
There are 1.42 billion cars owned globally - including 1.06 billion passenger cars and 363 million commercial vehicles.
How big is the global car market?
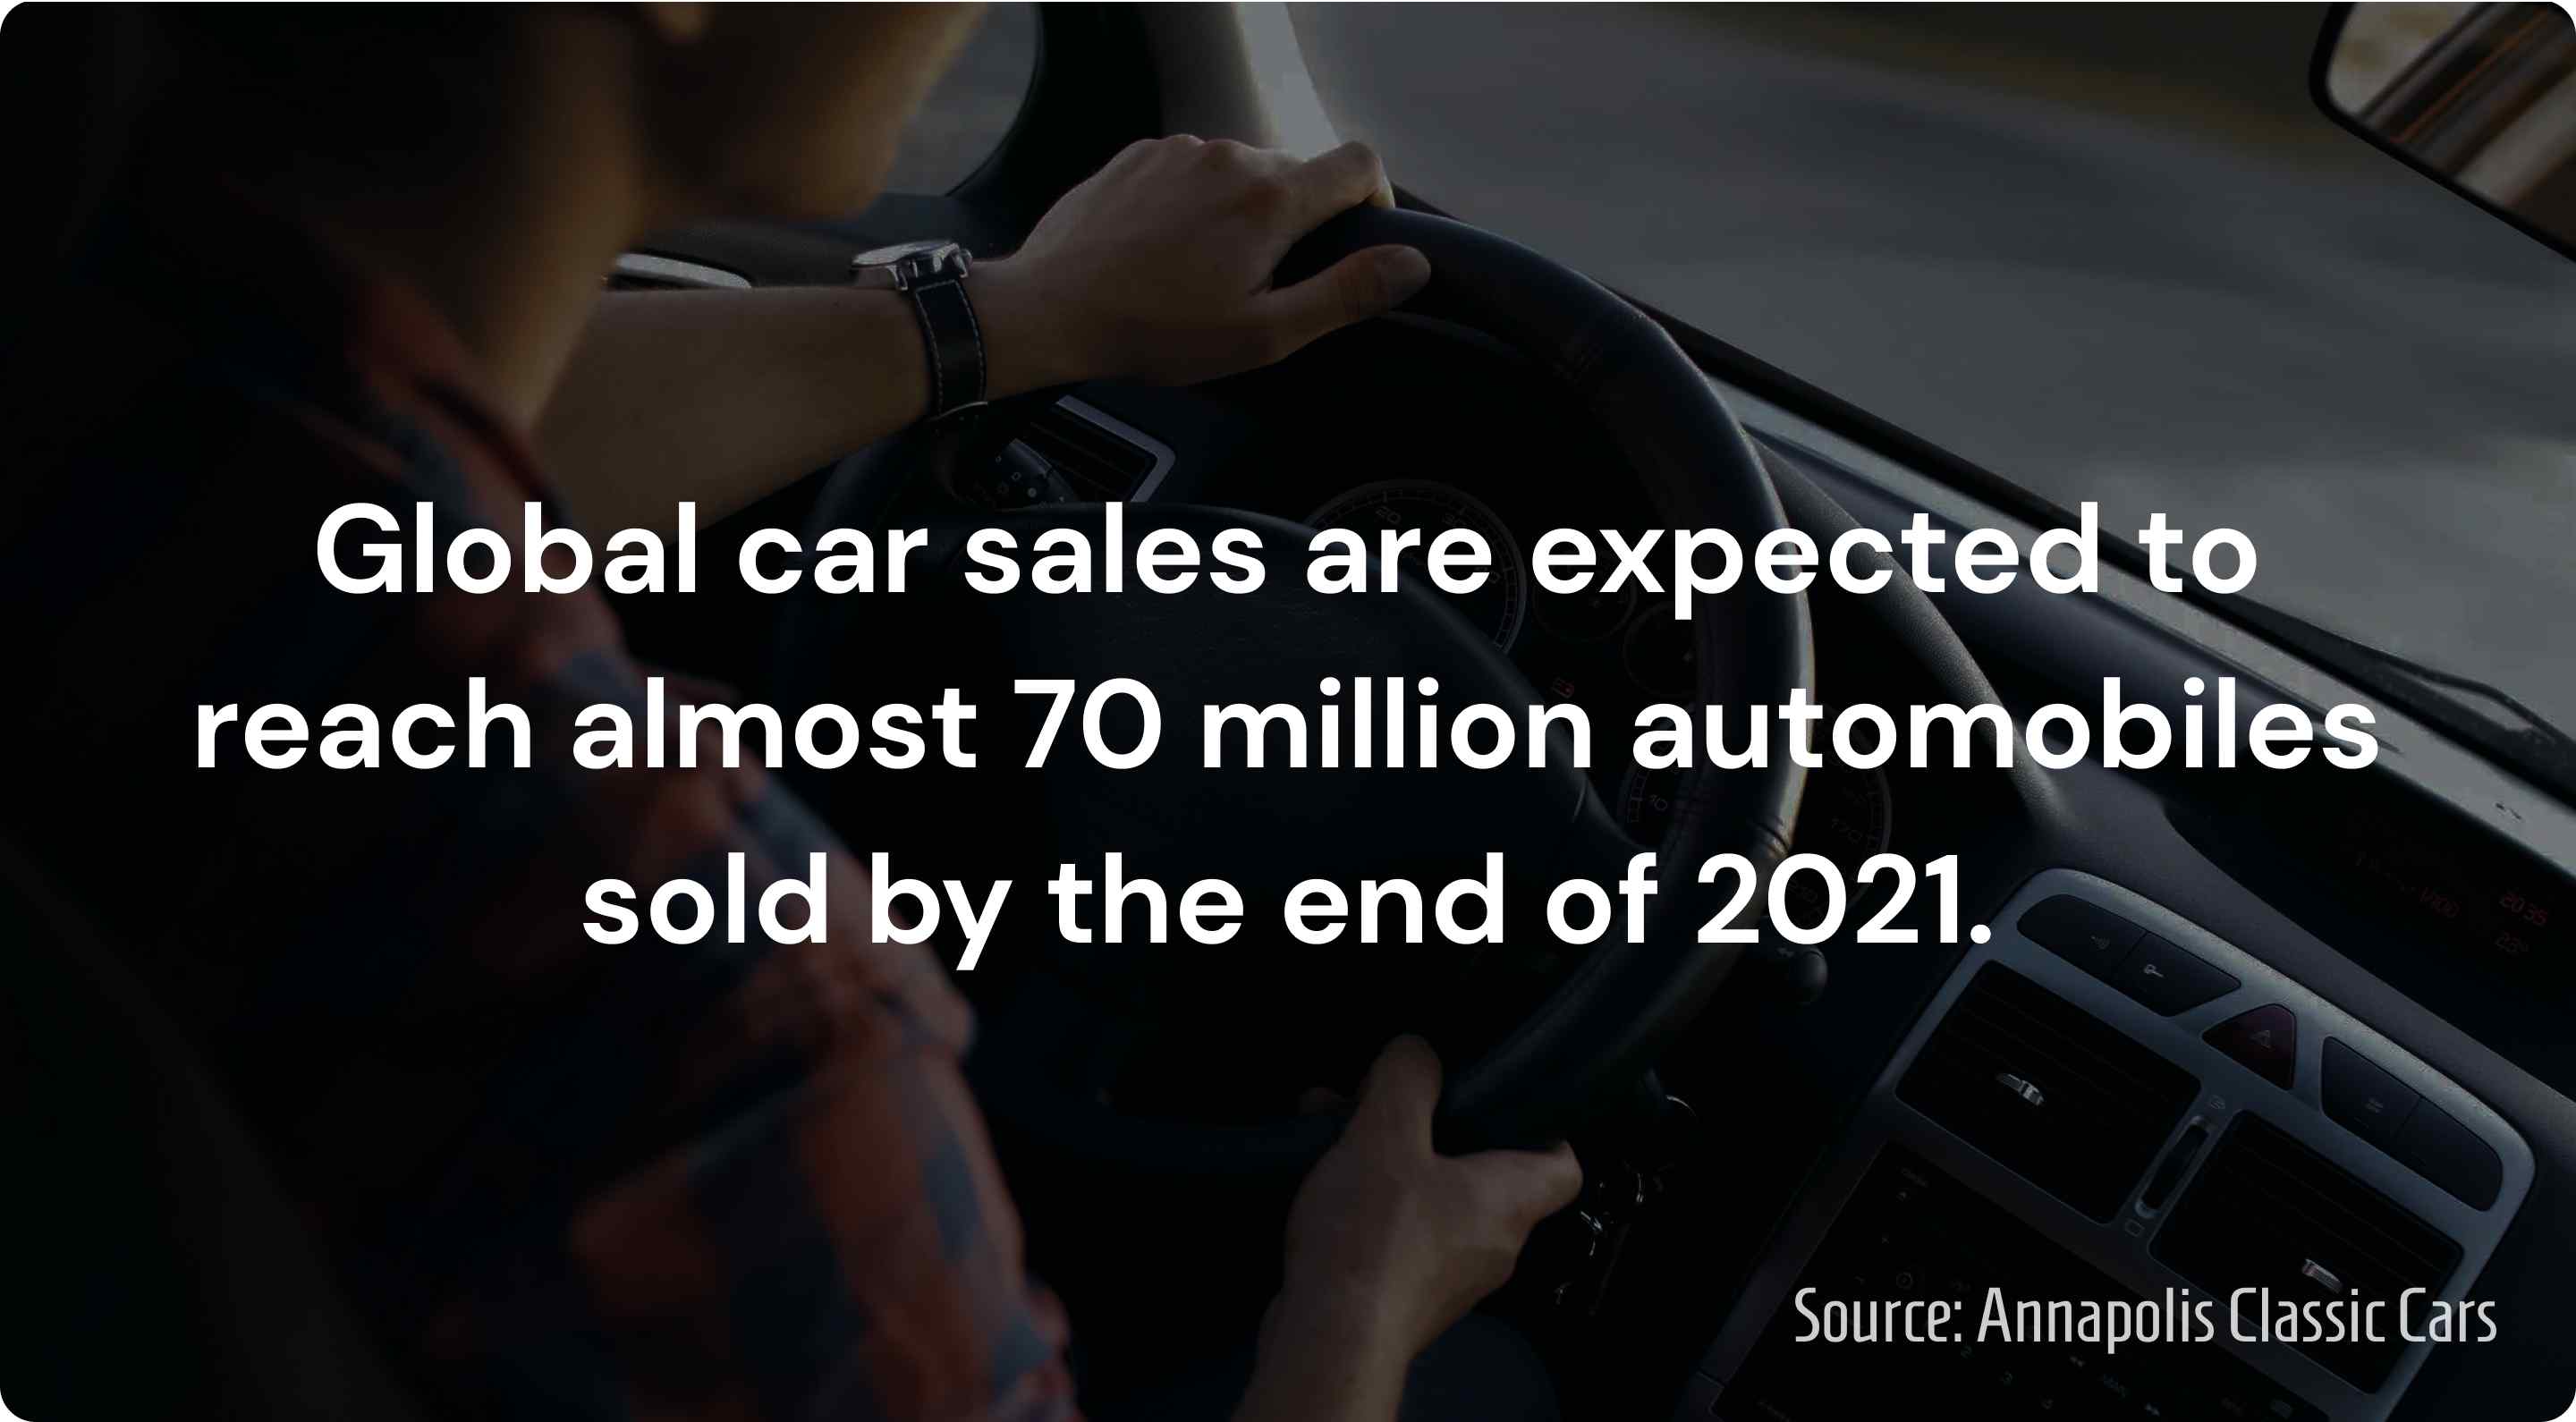
Global car sales are expected to reach almost 70 million automobiles sold by the end of 2021, an increase from 2020.
China is the only country that surpasses the U.S. in car ownership. As of 2017, China has more vehicles per household than the U.S. In fact, more than a quarter of all vehicles sold in the world that year were sold in China. Chinese car buyers purchased 27.5 million vehicles that year alone, and the trend is expected to continue due to the country's fast-growing population.
Chapter 8: Frequently Asked Questions
Does everyone in America own a car?
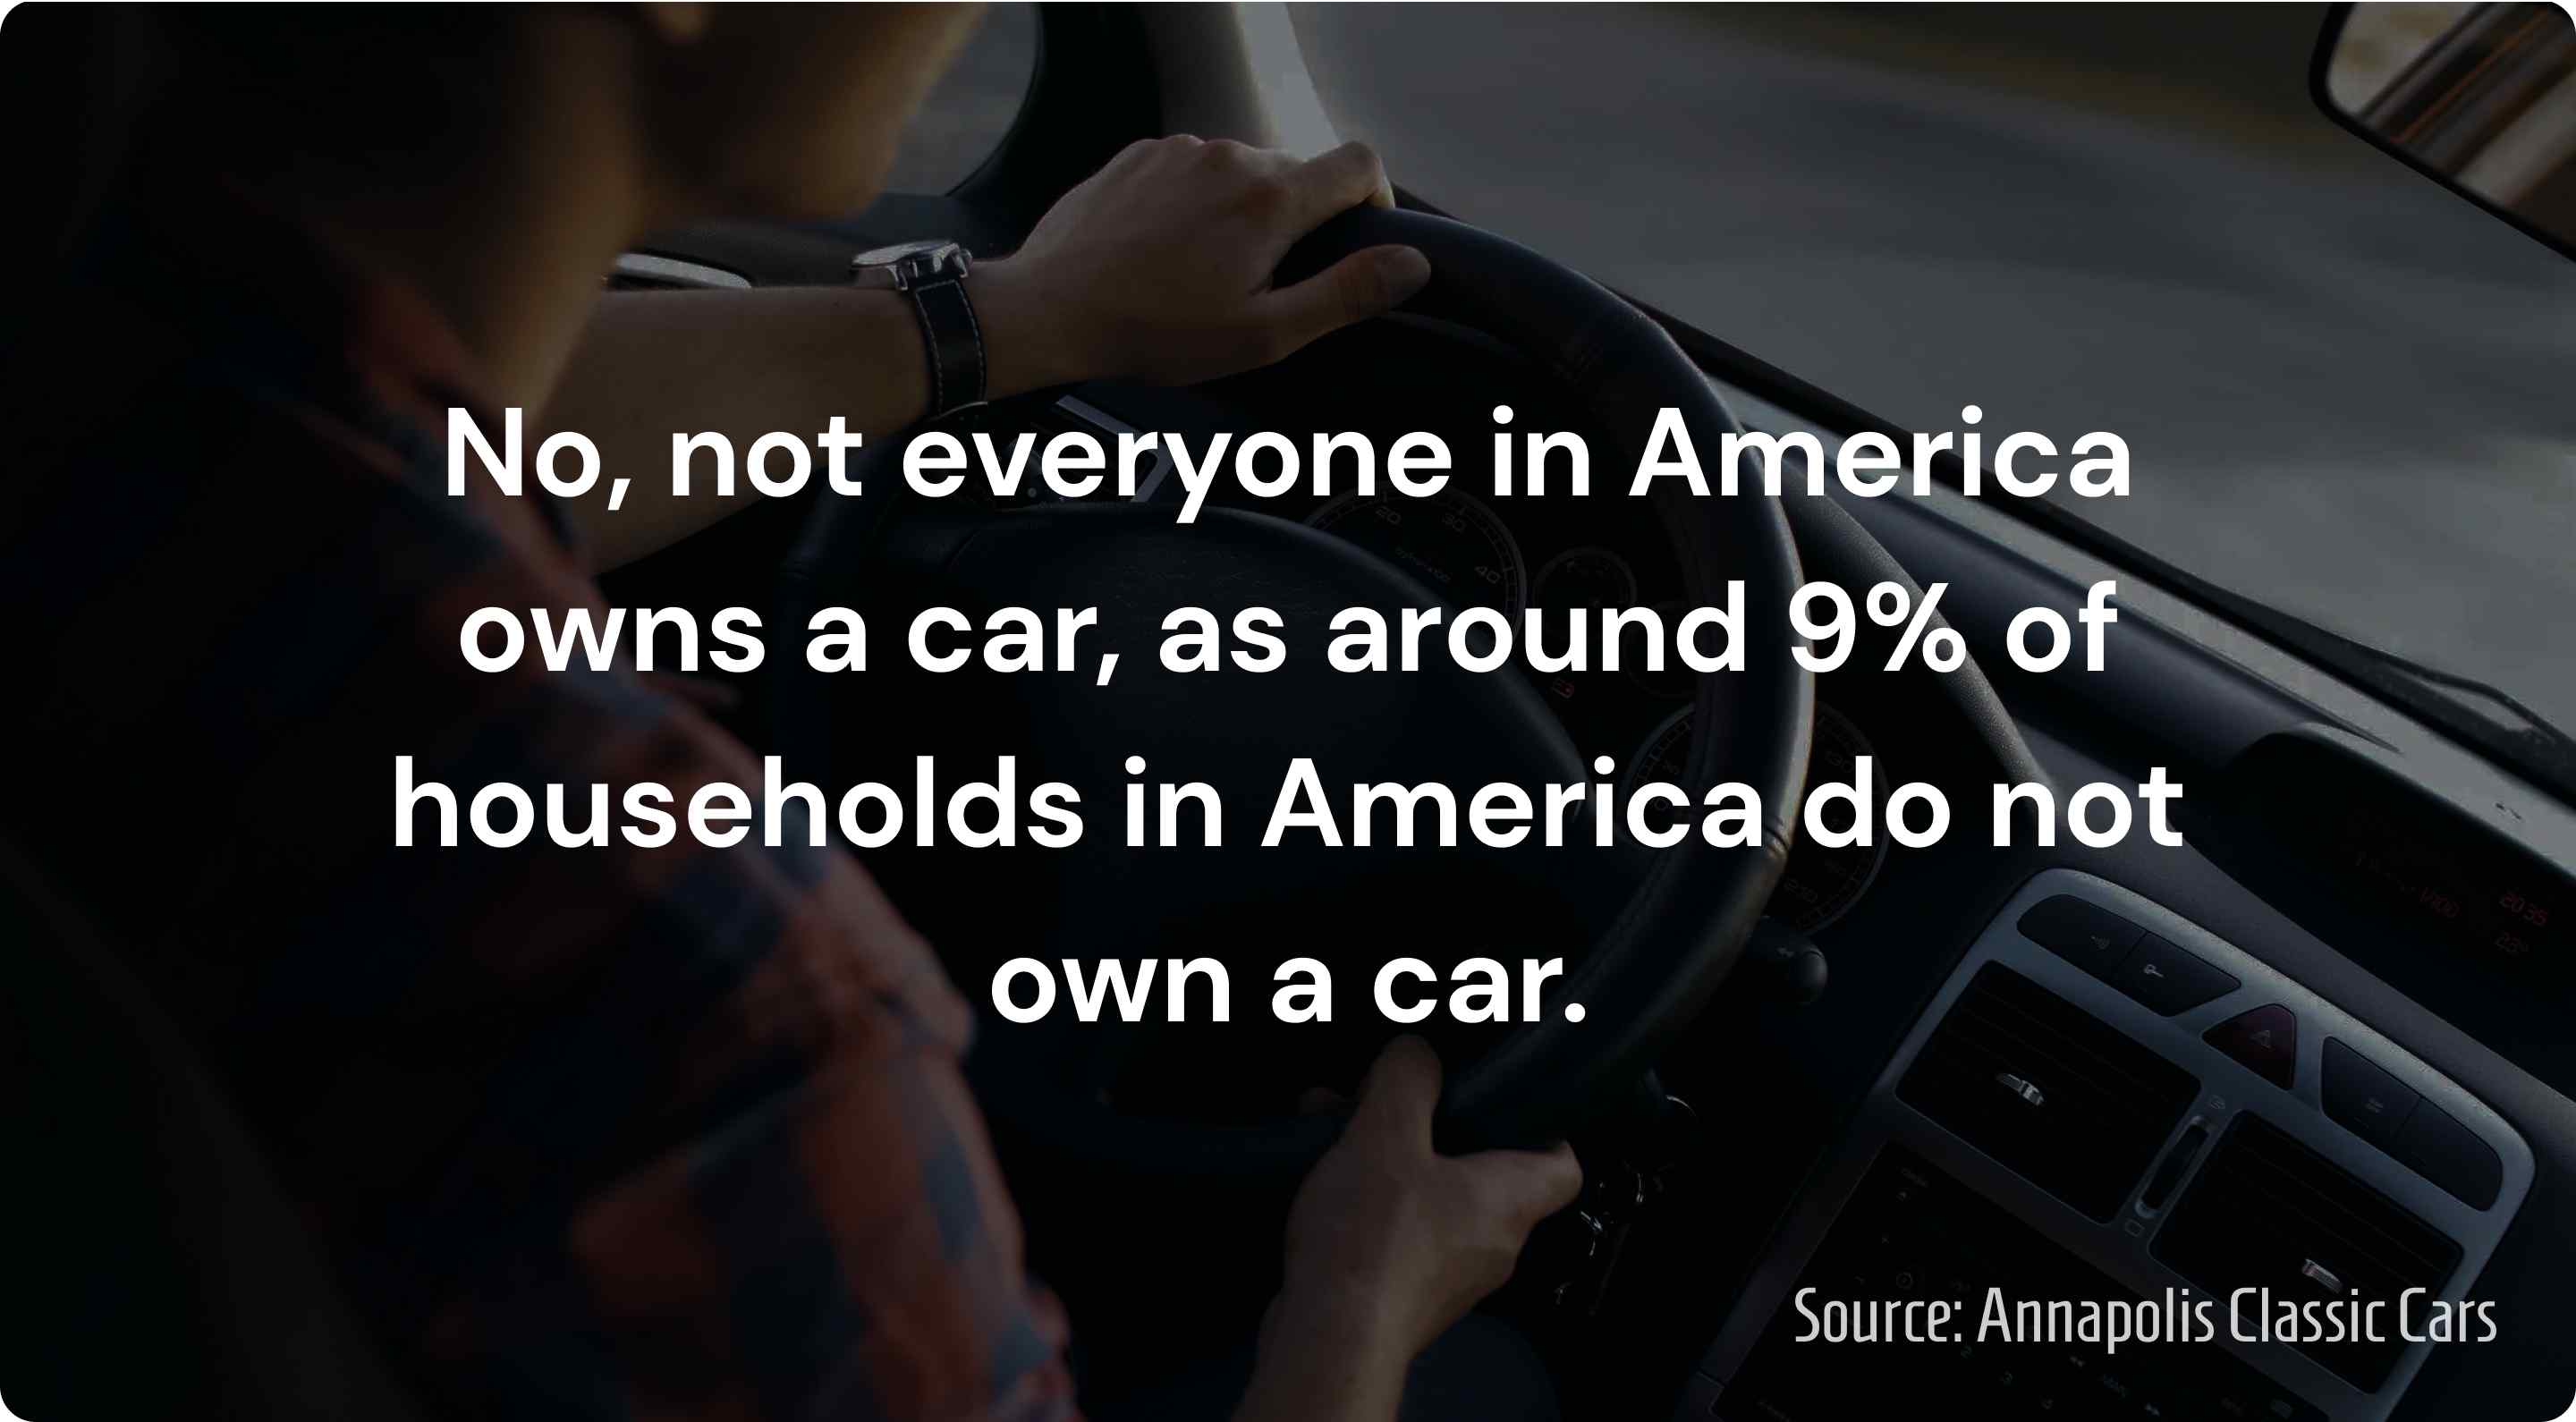
No, not everyone in America owns a car, as around 9% of households in America do not own a car.
Are there more cars than people in America?
The overall number of cars in America is less than the country's population. With that said, the US has one of the highest numbers of motor vehicles per capita in the world (around 840 per 1,000 people).
However, the data on how many Americans own cars varies significantly based on the location.
For example, states such as Montana, South Dakota, and Wyoming have a per capita availability of cars that's above 1, while other states like New York and New Jersey have it closer to 0.5.
Sources
- US Vehicle Registration Statistics
- Bureau of Labor Statistics
- Cox Automotive
- UC Berkeley News
- Governing.com
- Hedges & Company
- University of Michigan
- Statista
- Statista